Your Data.
Your Decisions.
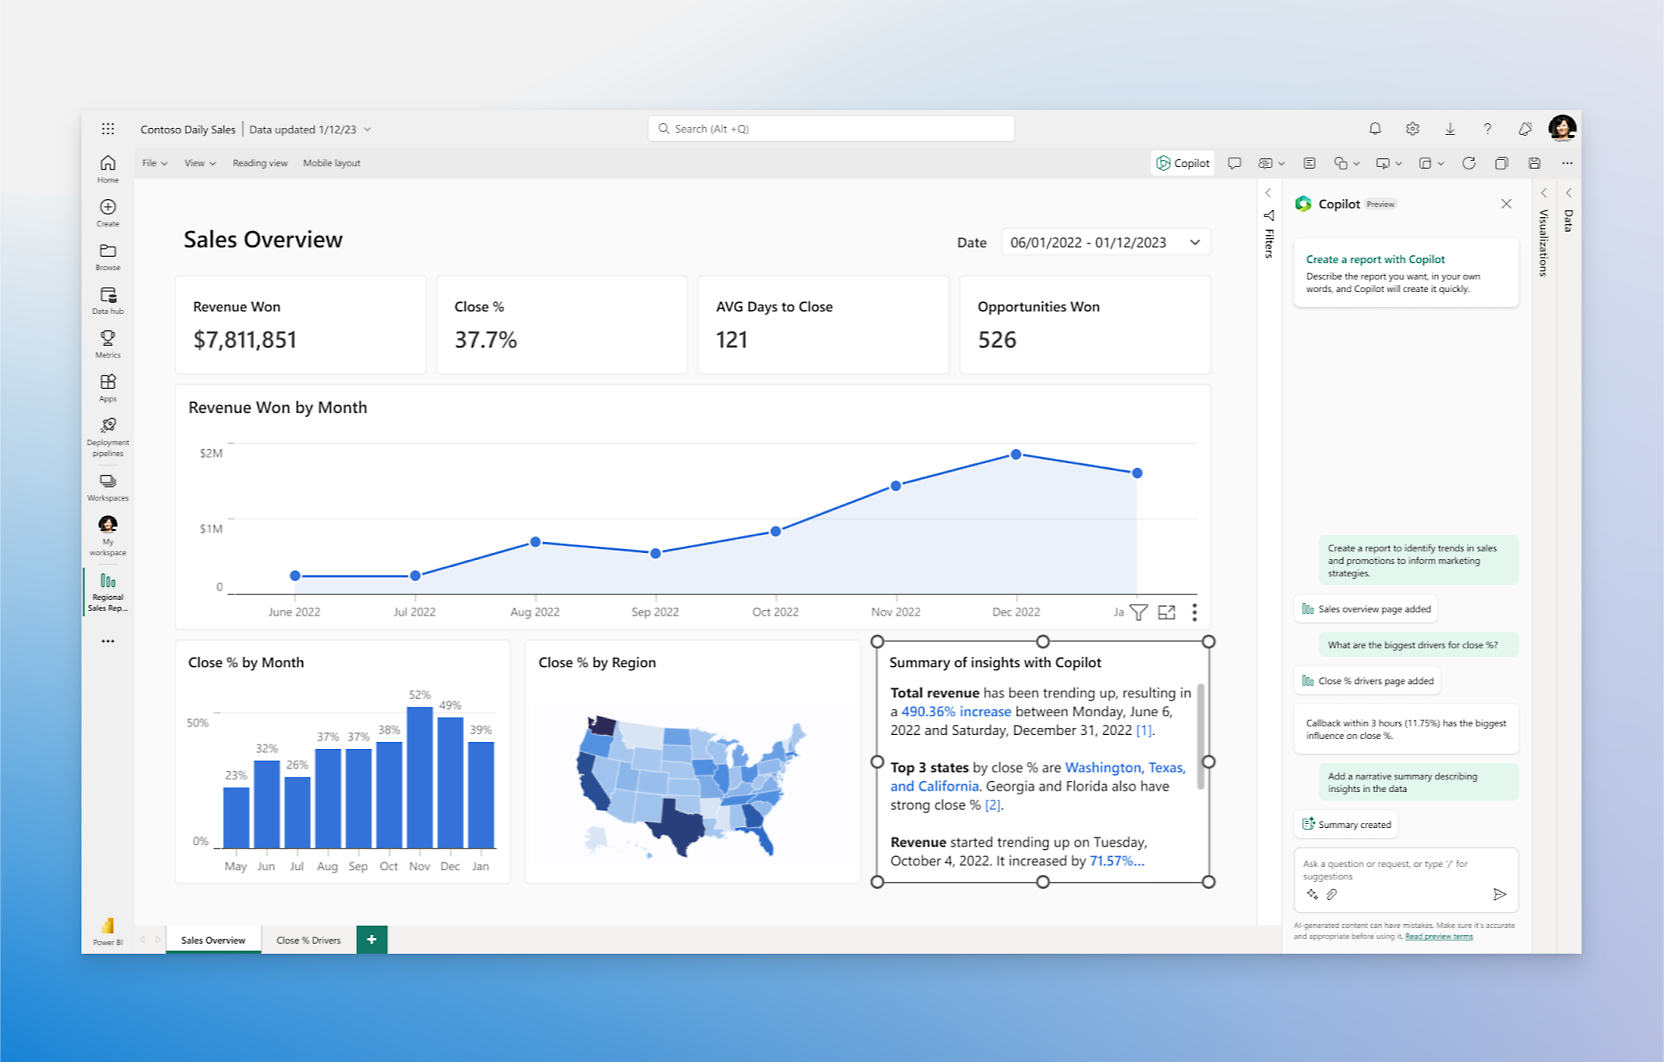
Transform raw data into beautiful, interactive dashboards. Empower every team to make faster, smarter decisions, without waiting for a report from IT.
Everything You Need to Become Data-Driven
Power BI goes far beyond charts and graphs, it's a complete analytics platform for your entire organisation.
Interactive Dashboards
Create stunning, interactive dashboards that let users slice and dice data without any technical knowledge. Click a bar chart and watch every visual on the page respond instantly.
Self-Service Analytics
Empower business users to answer their own questions from data, without relying on IT or analysts. Power BI's natural language Q&A means they can literally ask questions in plain English.
Real-Time Streaming
Monitor live operational data with streaming dashboards that update in real-time. Perfect for operations centres, sales floors, or any scenario where timing matters.
AI-Powered Insights
Power BI's built-in AI automatically surfaces anomalies, trends, and insights your team might miss. Ask natural language questions and get instant visual answers.
Governed Sharing
Share reports and dashboards securely across your organisation, or with external stakeholders, with row-level security ensuring everyone only sees data they're authorised to view.
Mobile & Anywhere Access
Native iOS and Android apps give your team access to live dashboards on any device. Reports are optimised automatically for mobile screens.
Analytics for Every Team
Power BI isn't just for analysts. It delivers relevant, actionable insights to every function in your business.
Executive Leadership
Real-time KPIs across the entire business on a single screen. Financial performance, customer metrics, and operational health, all in one place, updated live.
Sales Teams
Pipeline visibility, territory performance, and win/loss analysis. Sales leaders know exactly where to focus coaching and resources to hit targets.
Finance & Operations
Automated financial reporting replaces manual spreadsheet consolidation. Month-end reports that used to take days now publish themselves on day 1.
IT & Operations
Infrastructure health, support desk performance, and project delivery metrics, giving IT leaders the data they need to justify investment and demonstrate value.
Connect Everything
Power BI connects to over 100 data sources, bringing all your business data together in one place.
How We Implement Power BI
A rigorous approach that delivers reliable, trusted reporting from day one.
Data Discovery
Map all your data sources, understand data quality, and define what decisions you want dashboards to support.
Architecture
Design your data model, semantic layer, and security model, the foundation of reliable, scalable reporting.
Build
Create dashboards and reports that are beautiful, intuitive, and answer the right business questions.
Govern
Configure workspaces, access controls, refresh schedules, and data lineage tracking.
Enable
Train your team so they can answer their own questions and create their own reports confidently.
Frequently Asked Questions
Common questions about Power BI for Australian businesses.
How is Power BI different from Excel dashboards?
Power BI connects to live data sources and refreshes automatically, there's no manual export or copy-paste. It supports millions of rows, cross-filtering across all visuals with a single click, row-level security so each person sees only their data, and sharing via a browser without requiring Excel.
Can Power BI connect to our existing systems?
Power BI has over 100 native connectors including Dynamics 365, Business Central, SharePoint, SQL Server, Salesforce, SAP, Google Analytics, and REST APIs. If you have a data source, Power BI can almost certainly connect to it.
What does a Power BI implementation cost?
Implementation costs depend on the number of data sources, complexity of the data model, and number of dashboards. Oxana offers a proof-of-concept service so you can see the value before committing to a full build, and we quote fixed price after discovery.
How long does it take to build a Power BI solution?
A single-source dashboard with 3 to 5 pages typically takes 2 to 4 weeks. A full multi-source enterprise analytics solution with a shared semantic layer and governed workspaces takes 6 to 12 weeks depending on data complexity.
Do we need IT skills to maintain Power BI after implementation?
Not for day-to-day use. Business users can create their own reports from the data model Oxana builds. For ongoing maintenance of the data model or adding new sources, some technical knowledge is helpful, Oxana also offers managed Power BI support if preferred.
Stop Guessing. Start Knowing.
Let us build you a Power BI proof of concept using your own data, so you can see the value before committing to a full implementation.